Geographic Information Systems (GIS) have become an indispensable tool in many fields today. From urban planning to environmental conservation, the ability to capture, store, analyze, and visualize spatial data has transformed how we understand and interact with the world around us. But what exactly is GIS, and how is it applied in real-world scenarios?
GIS isn’t just a map or a software program. It’s a sophisticated system that allows users to see, interpret, and understand spatial data in ways that reveal patterns, relationships, and trends. It is used in a variety of industries to solve complex problems. Whether you’re curious about how GIS is transforming industries or you want to know more about its real-world applications, this comprehensive guide will help you understand what GIS is and provide detailed examples of its uses.
Geographic Information Systems (GIS) is a framework that allows users to gather, manage, and analyze spatial and geographical data. It combines various types of data into a single system, allowing for deep analysis of spatial patterns and relationships. The real power of GIS lies in its ability to visually represent this data through interactive maps and 3D visualizations, which can reveal insights that might be difficult to detect in raw datasets.
GIS is widely used in fields such as environmental science, urban planning, logistics, public health, and even law enforcement, all of which benefit from the geographic context that GIS provides. It isn’t just the software that makes GIS effective; it’s the combination of hardware, data, people, and methods working together to solve complex geographical problems.
How Does GIS Work?
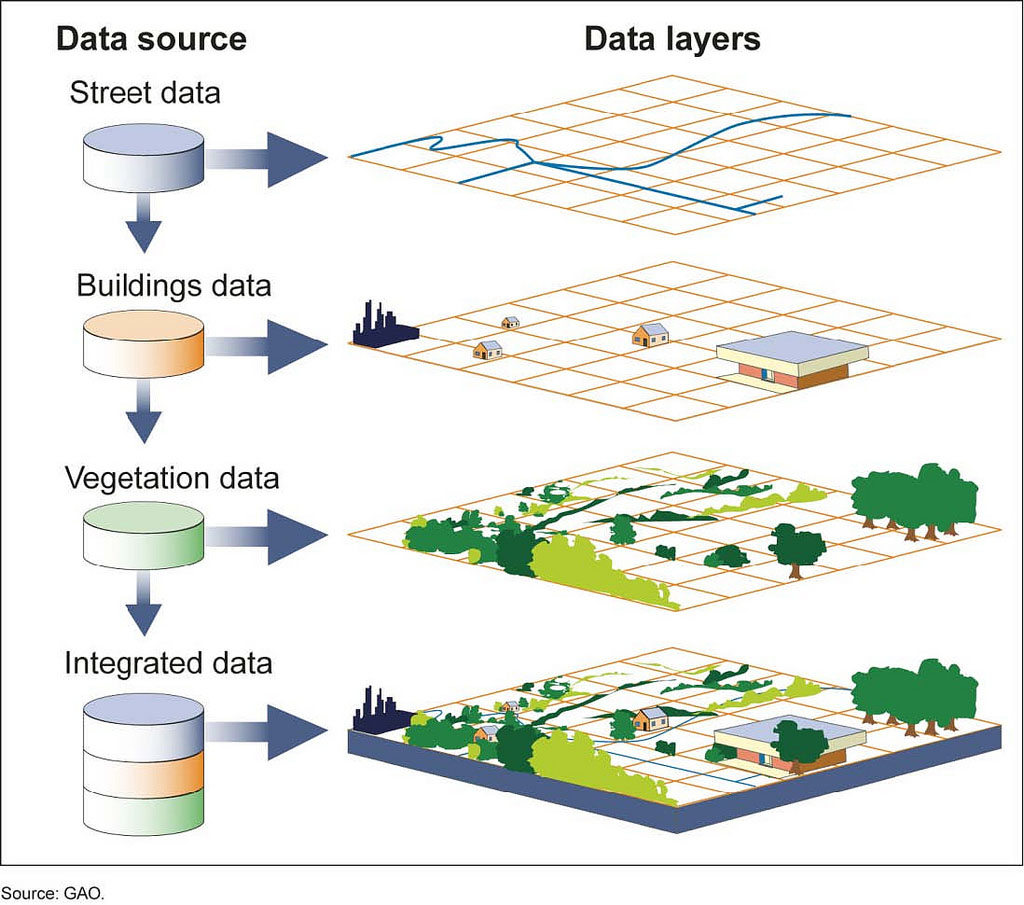
GIS works by integrating different layers of information in a way that allows users to analyze and visualize relationships within the data. For example, one layer could show a city’s transportation network, another layer might show land use, and a third layer could represent population density. By overlaying these layers, GIS users can identify patterns such as areas with high population density but low access to public transportation.
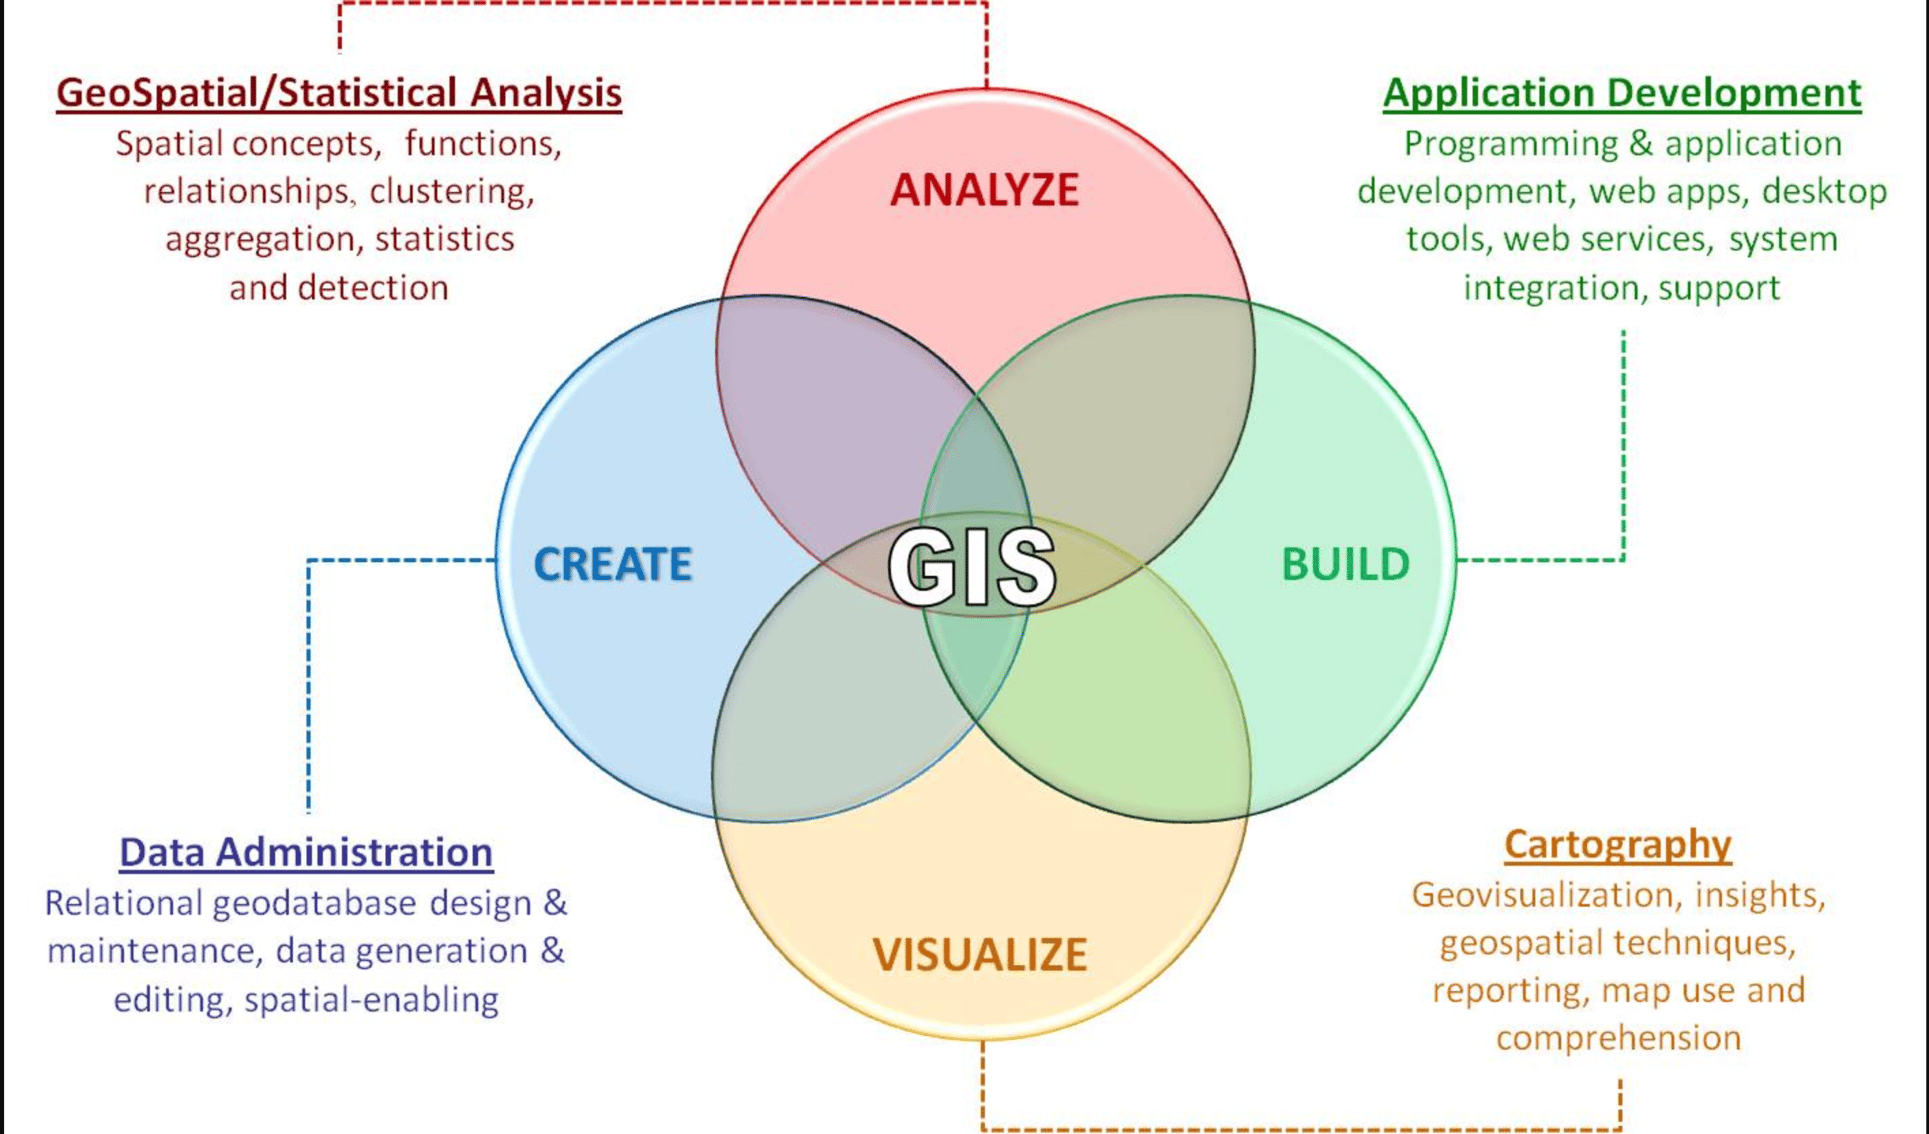
The key steps in a GIS process include:
- Data Collection: Gathering spatial data through GPS, satellites, drones, and surveys.
- Data Storage: Organizing data in databases, which can include geographical coordinates, attributes of places, and thematic information.
- Data Analysis: GIS uses powerful tools to analyze spatial relationships between different data points. It can reveal patterns like clustering, spatial trends, and relationships that wouldn’t be visible in raw datasets.
- Visualization: Finally, GIS presents the results in the form of maps, 3D models, and interactive visualizations. This step helps users make informed decisions based on their spatial analyses.
Key Components of GIS
A GIS system is composed of several essential elements that work together seamlessly to deliver actionable insights:
- Hardware: This includes the computers and devices used to run GIS software and store spatial data.
- Software: There are various types of GIS software, such as ArcGIS, QGIS, and Google Earth Engine, which provide the platform for mapping, analyzing, and visualizing data.
- Data: The lifeblood of any GIS system, spatial data can be collected from numerous sources, including satellites, drones, or GPS devices. Data can be categorized into two main types: vector data (points, lines, polygons) and raster data (grids, pixels).
- People: Skilled professionals, such as GIS analysts, planners, and data scientists, are crucial for interpreting the data and running the systems effectively.
- Methods: These refer to the approaches and techniques used to analyze geographic data, including spatial analysis, remote sensing, and data modeling.

GIS has become an essential tool across many industries because of its ability to bring data to life through spatial analysis and visualizations. The importance of GIS lies in how it provides context and clarity to data that might otherwise seem abstract or difficult to interpret. The power of GIS comes from its capability to uncover patterns, relationships, and trends that traditional data analysis methods cannot.
Role of GIS in Decision-Making
One of the most valuable aspects of GIS is its role in decision-making. Whether used by government agencies, private companies, or non-profit organizations, GIS helps leaders make informed, data-driven decisions. For example, in urban planning, GIS can be used to analyze traffic patterns and determine where new infrastructure should be developed. In environmental science, it helps in tracking changes in land use or monitoring environmental damage such as deforestation or pollution.
Key examples of how GIS supports decision-making include:
- Urban Planning: City officials use GIS to identify areas in need of infrastructure improvements, to optimize public transportation routes, and to manage zoning and land use regulations.
- Disaster Management: During natural disasters like hurricanes or earthquakes, GIS helps emergency response teams by providing real-time maps that show impacted areas and available resources.
- Business Development: Companies use GIS for market analysis, including understanding where potential customers are located, determining optimal store locations, and analyzing competitive landscapes.
The ability to layer different types of data—such as population demographics, land use, and environmental conditions—onto a single map allows decision-makers to see the bigger picture and make well-informed choices.
Benefits of Using GIS
The benefits of GIS extend far beyond maps and visualizations. Its real strength lies in how it transforms raw data into actionable intelligence. Below are some of the key benefits of GIS across various industries:
- Improved Accuracy and Efficiency in Data Analysis
GIS allows for precise data collection and analysis, reducing errors in decision-making processes. This is especially important in industries like logistics, where small errors can lead to significant cost implications. - Visualization of Complex Data
GIS helps simplify complex datasets by turning them into visual, interactive maps. For instance, a company trying to understand customer behavior in different regions can use GIS to visualize where sales are highest and lowest, helping to identify patterns and trends. - Real-Time Monitoring and Analysis
GIS offers real-time monitoring capabilities, which are critical for industries like disaster management, transportation, and environmental conservation. Emergency response teams can use GIS to track the spread of wildfires or floods and allocate resources accordingly. - Enhanced Communication
A well-designed GIS map can communicate complex information more effectively than raw data or traditional reports. For instance, policymakers can use GIS visualizations to advocate for infrastructure projects by showing the public the potential impact on their communities. - Cost Savings
By improving efficiency and providing clearer insights, GIS often leads to cost savings. For instance, in agriculture, precision farming techniques that rely on GIS have resulted in significant cost reductions by optimizing the use of water, fertilizers, and other resources.
Key Benefits of GIS in Different Industries
| Industry | Benefit of GIS |
|---|---|
| Urban Planning | Optimizes infrastructure development and zoning |
| Environmental Science | Tracks environmental changes, monitors deforestation |
| Transportation | Enhances route optimization and traffic management |
| Disaster Management | Supports real-time monitoring and resource allocation |
| Business | Improves market analysis and decision-making in store locations |
| Agriculture | Enables precision farming, optimizing resource usage |
GIS’s ability to bring together different types of data in a spatial format makes it a valuable tool in a world where data-driven decision-making is increasingly important.

GIS has a wide range of applications across different industries, making it a versatile tool that can be tailored to solve specific problems.
1. GIS in Urban Planning
Urban planning is one of the fields where GIS has had the most significant impact. Planners rely on GIS to understand how cities grow, how land is used, and where infrastructure needs to be developed. By analyzing spatial data, city officials can make informed decisions about zoning, transportation, and public services.
Example:
One powerful application of GIS in urban planning is mapping and managing land use. Planners use GIS to analyze areas designated for residential, commercial, and industrial purposes. GIS helps them identify areas of urban sprawl and decide where to build new roads, schools, or hospitals. Additionally, GIS can be used to map transportation networks and assess traffic congestion, helping to optimize public transit routes and reduce travel time for residents.
In Singapore, for example, GIS has been integral to its urban development strategies. The government uses GIS to map and plan the city’s land use, transportation systems, and green spaces. By visualizing the city’s growth, they have been able to develop strategies for sustainable development, ensuring that infrastructure keeps pace with the growing population.
2. GIS in Environmental Monitoring
GIS plays a crucial role in tracking environmental changes and promoting sustainable development. Environmental scientists use GIS to monitor natural resources, analyze pollution levels, and study the effects of climate change. The ability to visualize environmental data over time makes GIS a valuable tool for understanding how human activity impacts ecosystems.
Example:
In the Amazon Rainforest, GIS has been used to track deforestation and illegal logging activities. By analyzing satellite imagery, conservationists can monitor changes in forest cover and take action to prevent further deforestation. This information is vital for creating policies that protect biodiversity and combat climate change.
In Costa Rica, GIS has been used to map the country’s rich biodiversity and manage its protected areas. GIS tools help researchers track species populations, assess habitat quality, and monitor environmental changes such as forest cover loss or climate shifts. This data enables the government and environmental organizations to make informed decisions on conservation efforts.
3. GIS in Disaster Management
When disasters strike, having up-to-date spatial information is crucial for effective response and recovery efforts. GIS helps emergency responders by providing real-time maps that show affected areas, available resources, and evacuation routes.
Example:
During Hurricane Katrina, GIS was used extensively to map the areas affected by the flooding and to coordinate relief efforts. By overlaying satellite imagery with city maps, emergency teams were able to pinpoint the hardest-hit neighborhoods and direct resources where they were needed most. GIS also helped in identifying evacuation routes and planning the deployment of rescue teams.
In Japan, which frequently experiences earthquakes and tsunamis, GIS is used to predict the impact of natural disasters and plan response efforts. The Japanese government uses GIS to identify earthquake-prone regions and create risk maps that inform urban planning and building codes.
4. GIS in Agriculture
Agriculture has benefited tremendously from the use of GIS, especially through the concept of precision farming. By analyzing spatial data, farmers can make informed decisions about where and when to plant crops, how much water to use, and how to maximize yields.
Example:
GIS is used to analyze soil types, crop yields, and irrigation needs, allowing farmers to optimize their resources. For instance, farmers can use GIS to map soil moisture levels, which helps them decide where to focus irrigation efforts. GIS also helps farmers monitor crop health using satellite images, which can indicate areas where plants are under stress due to pests or lack of nutrients.
In India, precision agriculture has seen widespread use with GIS mapping technologies. Farmers use GIS to assess soil health, water availability, and crop patterns, resulting in more efficient land use and higher yields. GIS has also helped reduce the use of water and fertilizers, leading to more sustainable farming practices.
5. GIS in Transportation
Transportation systems around the world are becoming increasingly complex, and GIS is at the heart of efforts to make them more efficient. GIS helps in route optimization, traffic management, and the planning of new infrastructure.
Example:
In cities like New York and London, GIS is used to manage public transportation systems, optimize bus routes, and reduce congestion. By analyzing data from traffic sensors, GPS devices, and historical patterns, transportation authorities can identify bottlenecks and reroute traffic in real-time to ease congestion.
GIS also supports long-term planning for new infrastructure, such as highways, subways, and bike lanes. By analyzing population growth patterns and transportation needs, planners can design transportation networks that accommodate future demands.
Summary of GIS Examples in Various Fields
| Field | GIS Example |
|---|---|
| Urban Planning | Mapping land use and optimizing public transportation routes |
| Environmental Monitoring | Tracking deforestation and managing protected areas |
| Disaster Management | Coordinating relief efforts during natural disasters |
| Agriculture | Precision farming for resource optimization |
| Transportation | Managing traffic flow and planning new infrastructure |
These examples demonstrate how GIS is not just a tool for mapping but a comprehensive system that helps solve complex problems across various industries.

What Is Gis? (+how To Use It Improve Your Business)

To truly understand the power and versatility of GIS, it is helpful to look at specific real-world projects that have successfully used this technology. One such example is the use of GIS in wildlife conservation, where geographic information systems have played a pivotal role in tracking animal migration patterns, protecting endangered species, and managing natural habitats.
Overview of the Wildlife Conservation GIS Project
In a wildlife conservation project aimed at protecting endangered species like the African elephant, GIS was used to track the movement patterns of elephants across large expanses of land in Africa. The objective was to understand how these animals move between protected areas, identify critical migration corridors, and determine how human activity, such as deforestation or urban development, affects their movement.
The project utilized GPS collars on a number of elephants to record their precise locations over time. This data was then fed into a GIS platform, where researchers could map the movements of the elephants and overlay this with other geographic data, such as the locations of villages, farms, and roads.
How GIS Was Utilized in the Project
1. Data Collection:
The first step involved gathering data from the GPS collars placed on the elephants. These collars transmitted location data at regular intervals, creating a dataset that showed the elephants’ movements over weeks and months. Additional data, such as satellite imagery and land use maps, were also collected to provide context for the elephants’ movements.
2. Analysis of Migration Patterns:
Using GIS software, researchers were able to map the elephants’ movements and visualize their migration routes. By layering this data with maps of human settlements and land use, the team was able to identify areas where the elephants were at risk of encountering human activity. This type of spatial analysis was crucial for understanding how human encroachment was affecting elephant migration.
3. Identifying Critical Corridors:
One of the main goals of the project was to identify critical wildlife corridors—areas of land that connect different protected habitats and are essential for the survival of migratory species. Using GIS, researchers could pinpoint these corridors and assess their condition. For example, the system revealed that certain corridors were being blocked by new developments, such as roads or farms, creating bottlenecks that restricted elephant movement.
4. Visualizing the Impact of Human Activity:
The ability of GIS to layer multiple types of data allowed researchers to see exactly where human activity was impacting wildlife. By comparing elephant migration patterns with maps of deforestation, urban development, and agricultural expansion, the team could recommend conservation strategies. For instance, GIS analysis showed that certain areas of farmland could be moved to less critical regions, preserving essential migration routes for the elephants.
Impact of the GIS Project on Wildlife Conservation
This GIS-based project had significant implications for wildlife conservation efforts. The insights gained from the data allowed conservationists to:
- Implement New Protected Areas: The identification of key migration corridors led to the designation of new protected areas in regions that were critical for the elephants. This helped to ensure that these animals could move safely between their habitats without coming into conflict with human settlements.
- Develop Land Use Policies: Governments and conservation organizations used the GIS data to create more sustainable land use policies that minimized the impact of human development on wildlife. For example, road-building projects were redirected to avoid crucial migration corridors, and farmers were incentivized to plant crops in less ecologically sensitive areas.
- Monitor Changes Over Time: GIS was not only used to assess the current situation but also to monitor changes over time. By continuing to collect data on elephant movements and land use, the project could track the effectiveness of conservation measures and adapt strategies as needed.
This case study is just one example of how GIS can be used to solve complex, real-world problems. In this instance, GIS provided the tools needed to visualize and understand the relationship between wildlife and human activity, leading to more informed conservation strategies. Without GIS, it would have been difficult to gather and analyze such a vast amount of data, let alone present it in a way that could drive meaningful action.